
My plan since I left school had been to work as a scientific researcher doing part-time illustration on the side. However, as I reached the end of my degree, I realised I wasn’t interested enough in research to commit four years to a PhD. A graphic design placement in Melbourne convinced me I wanted to take a chance on a career in illustration or design, but I was too interested in science to abandon it completely. It was an internship with the science illustration studio Equinox graphics that made me realise that science illustration was a niche I could work within. Not many illustrators have formal scientific training, and those that came into illustration from a science background often worked with photography or 3D modelling rather than freehand drawing. I’ve been working as a freelance illustrator for a year now, mainly with academic establishments designing illustrated posters for seminars, but I’ve also produced concept sketches for 3D renders and animation, and step-by-step diagrams for biotechnology start-ups to illustrate how their product works.
Illustration in Science
I believe that illustration is a key skill in science. Try to imagine an anatomy textbook without any illustrations. It is possible to achieve a similar effect with photography, however a good illustration will minimise all the noise in an image and draw the focus onto the important details of the image. This is particularly important in the fields I work in, such as cell biology and genetics, where it might not be possible to acquire a photograph, never mind a good one. Illustrations or diagrams are a very efficient way of introducing a topic to someone. People are more receptive to different forms of text: incorporating more visually information opens up ideas to an audience who may not gain as much from text alone.
For this reason, I think scientific papers should include a one-page summary infographic of the methods and results from their experiments. This could act as a middle ground between the abstract and the paper itself that would, a quicker reminder of the contents to save scanning a few pages of text.

FUNCTIONAL AREAS OF THE BRAIN
The majority of illustrations for areas of the brain label the functional areas with words such as ‘memory’ or ‘taste’. This makes sense from a teaching standpoint however usually results in increasingly smaller typefaces as words are crammed onto smaller areas. I wanted to make an illustration that represented these functional areas using pictograms rather than text. This was partly for aesthetic reasons, but also to make understanding more accessible compared to illustrations that use specific but overly-academic terms for most viewers.

CELLULAR POLARITY: FROM MECHANISMS TO DISEASE
This illustration was created for the poster of a Royal Society symposium of the same name. There were 16 different speakers at the talk and we wanted to create an illustration that encompassed all the topics being spoken about, rather than simply sourcing a single photograph. The key themes of the symposium were ‘Emergence of cell polarity’, ‘Molecular mechanisms of cell polarity regulation’, ‘Cell polarity in development’ and ‘Cell polarity and cancer’. The organisers of the event wanted an illustration that referenced both the existence of polarity in cells, defective polarity mechanisms, the image analysis mechanisms used to study cellular polarity, and the medical applications of the research. The final illustration features a progression from wild-type and mutant Schizosaccaromyces pombe cells that are digitally analysed to determine polarity features, and finally turn into drug capsules. The uniform colour scheme within in the illustration as well as the consistent style gave a better visual link between the separate research areas in the talks compared to a photomontage, where different levels of image quality and resolution would have spoiled the effect.

MODEL ORGANISMS
This infographic compares the five most common model organisms used in Genetics research. Model organisms are used to allow research in the same area to be more comparable. Often the model organism used is chosen by the expertise in handling of the lab members. This infographic compares model organisms by other features that might make them more or less suitable for a particular investigation, such as their genome similarity to humans, genome complexity, storage requirements, lifespan, costs and existing literature. This infographic was placed in the top 10 of the infographics category for the International Science & Engineering Visualization Challenge 2012.

SYNTHETIC BIOLOGY
This illustration was created as a concept sketch for artwork for the Systems Biology department of a US University. Illustrations of synthetic biology commonly feature a nod to Frankenstein, or the idea of someone accidentally creating a malevolent life form in their garage. Another popular approach is the use of lego to reference the ‘Biobricks’ of the iGEM (International Genetically Engineered Machine) competition. We wanted to reference the use of synthetic biology to create biological factories, constructing biochemical pathways within simple organisms such as Saccaromyces cerevisiae to synthesise drugs such as artemisinin. This sketch referenced chemical synthesis within an organic chemistry lab, however we later opted for a sketch that focussed more on industrial scale chemical engineering.
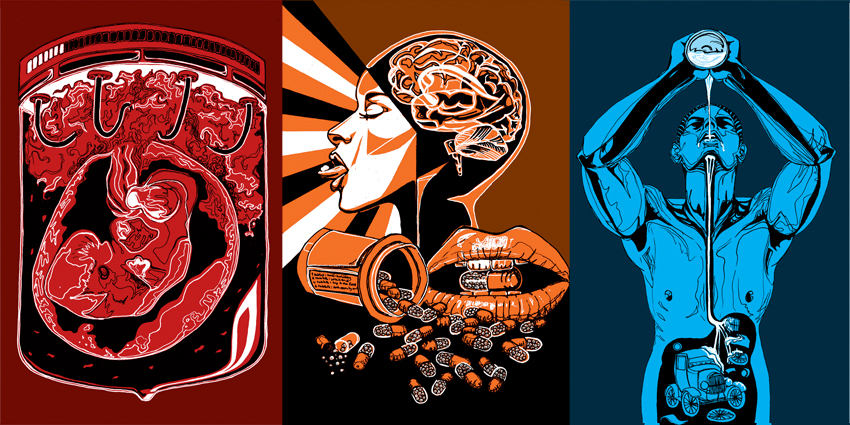
BRAVE NEW WORLD
These illustrations were created for the House of Illustration competition to illustrate Aldous Huxley’s Brave New World. I wanted to approach the book from the scientific and technological angle, trying to approach any human representations in the book in the style of anatomical drawings, and making them secondary to the technological and scientific advances that featured in the book.
Claudia Stocker is a science illustrator working in London.
